
Chapter 6:
Why applying ideological equity controls is hurting gifted academic performance.
Lindbergh Schools District’s gifted program (LEAP) has long been the crown jewel and
a source of pride. The idea of the gifted program has always been to allow students
who are not academically challenged in the classroom to fully realize their intellectual
potential in a program especially designed for this purpose. Missouri’s Department of
Elementary and Secondary Education (DESE) refined this objective by creating
guidelines for schools, one of which is that only students scoring in the top 5 percentile
of IQ scores should be eligible to participate in the gifted program.
Just five years ago, students participating in Lindbergh’s LEAP program had an
advanced average grade proficiency on DESE annual tests of more than 90% in most
categories and grade levels. This was to be expected since most students participating
in a gifted program typically perform well above their grade level and their peers.
In 2023, our gifted program performance showed a dramatic downturn. While some of the shift could be attributed to the disruption in classroom instruction caused by COVID, changes in district screening and identification procedures for the program have played a far more significant role. This alternative identification is effectively a form of affirmative action, using different screening standards for students based on demographic profiles. Students participating in the gifted program now make up 14% of the school population in some grades, while their advanced grade proficiency ranges between 60%-70%.
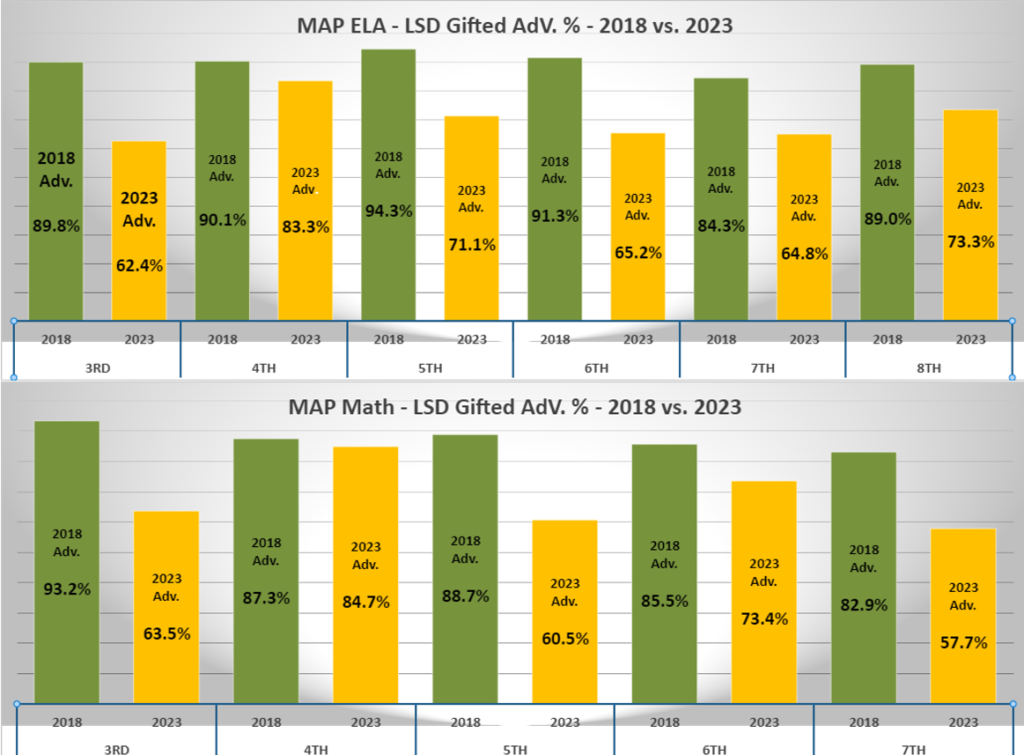
While I understand our school wishes to increase student participation to meet district MSIP6 ranking, I also believe we are devaluing the academic excellence of the gifted program, whose original intent was to challenge truly gifted students (top 5 percent IQ).
* Lindbergh Schools Executive Summary concerning gifted and honors program evaluation (source, Lindbergh Schools Board Docs)
It is time we pivot back and allow truly gifted students to excel according to their
abilities. I believe it is important to help every student no matter where they are
academically, and support them so that each student has the same opportunity to
achieve their maximum potential. After all, is this not what education is about?
On April 2nd, vote for David Randelman. Let’s put common sense back in academics.
Chapter 5:
Lindbergh VS Kirkwood 2017-2022
Traditionally, Lindbergh Schools has always been neck and neck with other top tier school districts such as Kirkwood. In 2017 the MAP data showed very close proficiency rates:
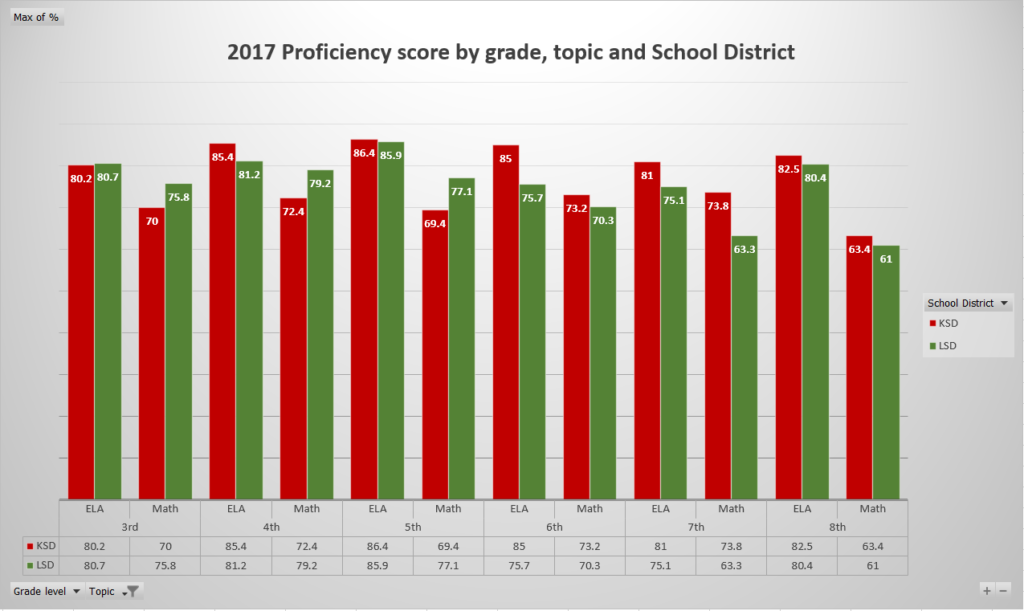
Source of data: MAP. The graph shows a slight edge to Kirkwood but all in all these two districts are still very close.
Since we established in chapter 4 that NWEA data corelates well to MAP data based on the NWEA case study; we can now use it to assess where we are compared to Kirkwood in terms of MAP in 2022.
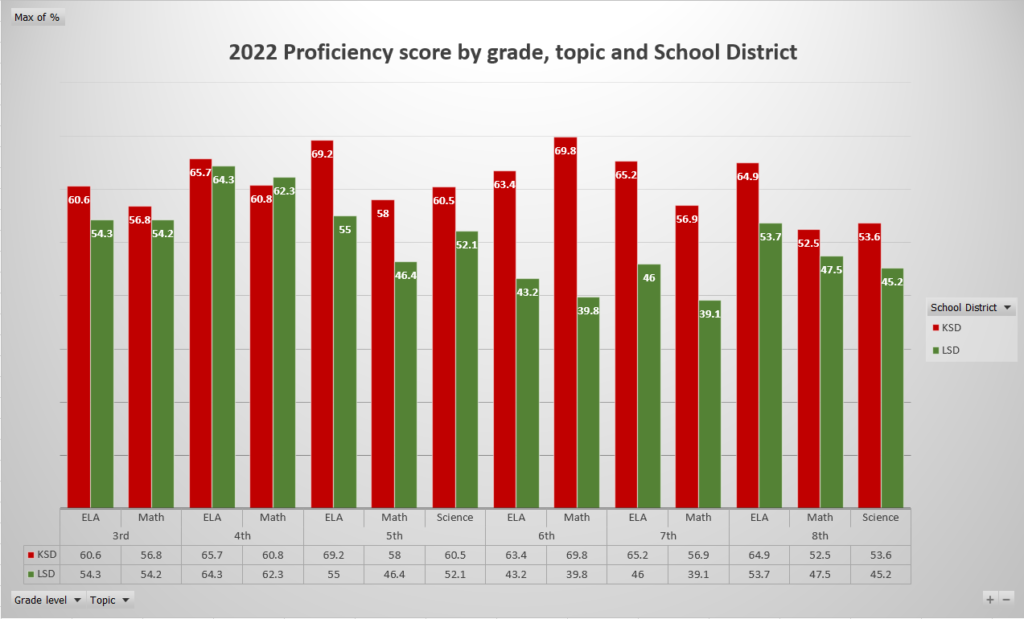
As one can see, our gap between us and Kirkwood has grown, especially in 5th-8th grades. We know that post pandemic the state average has gone way down for all school districts, Lindbergh Schools is by no means unique in terms of academic decline. It is also true that we are still above the state average. However, we can still observe that it is possible to improve. However, let us not only rely on NWEA data or MAP data. Another important metric is our reading in the lower grades. Lindbergh Schools uses a benchmark program for reading called FastBridge that is also used in the Kirkwood School District. Both districts use the same aReading test on their 2nd and 3rd grades:
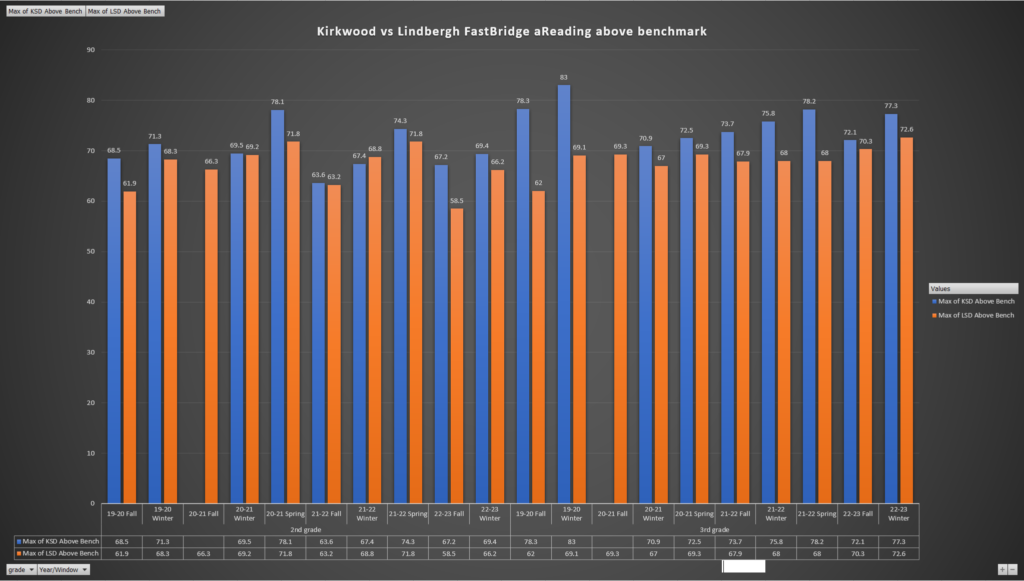
We can see that this exam helps confirm NWEA and MAP validity on our gaps. FastBridge is given three times in a school year, Fall, Winter and Spring. This is an important metric as it helps show individual and grade progress throughout the school year. As one can see, we do make progress but, again, we could do better. I know all this data can raise some concerns so I will frame it with some positive perspective:
- The high school is still doing relatively well, I believe the resources and efforts there have helped keep it an academic success but we do need to work on our challenges in the lower grades to close the gaps.
- We have the best teachers and great district employees who care for our student success, this is not a reflection on them but rather indications that the community needs to help the district pivot back to a more academic focused mission and better support for our teachers.
- Sometimes when you truly love and care about someone or something you share information as constructive feedback. I hope that the community will rally alongside for a common cause of supporting our district and doubling down on making sure we remain with the school district we have always known, that has served the community faithfully and with excellence.
*FastBridge data was retrieved through direct sunshine requests to both LSD and KDS. MAP data was retrieve through DESE.
Chapter 4:
MAP and NWEA – How to understand the results and which benchmark should we look at?
Preface:
As parents, community, and stakeholders we are all interested in both how our school is doing as a district compared to other districts and of course how are our individual students doing. In recent years, tools have been added to our district, enabling us to gain a better understanding of how our students are doing. We know that in general, we are about ~50% proficient (meaning 50% not meeting state standards) in most areas in the elementary and middle school. However, these tools are also complex and sometimes confusing. So, how can we dispel some of the mystery around these numbers? Does NWEA reflect MAP outcome? We believe the answer is yes, based on the data! In this chapter we will try and answer this question with the evidence.
It is important to say that these results are not reflective of our teachers or their performance. In fact, as we go through these results, we believe it will show that our teachers need far more support with changes, challenges, and the workload they are dealing with.
Let us begin with some definitions:
MAP: (Missouri Assessment Program) is a state required benchmark for school accreditation and accountability. The primary use of MAP for residents has historically been to benchmark and select school districts based on their performance results.
NWEA: (Northwest Evaluation Association) a benchmarking tool primarily focused on providing information to the school district and teachers, it allows for trimester progress reports (as opposed to MAP which is an end-of-year benchmark), it allows for insight to tailor instruction for students and allow the administration and teachers to make adjustment to instruction and lesson plans and provide a more guided tracking of school objective goals in each grade level.
What has happened with MAP in recent years?
Looking at the data, more than 80% of Lindbergh Schools Elementary students scored above proficient in ELA in 2015, 2016, and 2017. In Mathematics, more than 73% of elementary students were proficient in those same years. In Middle schools, 60-80% were proficient in ELA and 57-65% in Mathematics.
In 2021, Elementary students who scored proficient in ELA dropped to 48-64% (from more than 80%), only 37-41% of them were proficient in Mathematics (drop from 73%). In Middle schools, 43-50% were proficient in ELA (drop from 60-80%) and in Mathematics, 35-39% were proficient (drop from 57-65%).
Did Lindbergh Schools truly decline in its academic performance?
The short answer is yes, but also, let us revisit what the district has told us in recent years: It was described that the district stopped “teaching for the test” compared to the “golden days” (when the district was ranked as a number one top district in the state of Missouri for a few years in row), the district used to prepare the students for three weeks prior to the test to maximize the outcome. After receiving the results in the fall period of the next school year, the district used to hold “Academic All Stars” nights where all students who scored proficient and above in all tests (ELA, Math and Science in 5th and 8th grades) were honored.
This approach was claimed to cause stress in students and created hard feelings for some students who felt left out of the celebration. These stressful preparations and “exclusive” celebrations of student’s success are not implemented in Lindbergh Schools any longer. This change in approach also explains the decline of performance prior to pandemic of COVID-19 (2018-19).
There were also claims that the MAP test has changed over the years and therefore, the drop was seen statewide. The assessment happened only at the end of the school year so it could not have reflected the real ability of students who may have had a “bad day”. Some students had become not interested in the outcome since they had no accountability through MAP compared to ACT, for example. MAP results would have been delivered after the next school year had already begun so any needed intervention or improvement were not possible through this program.
To truly help the focus on the academic growth of students, there should be assessments of where students are at during the school year so that instruction can be adjusted for optimal academic growth. MAP does not provide this capability. Claiming the “decline” of the district’s academic performance only through one assessment at the end of the school year was “unfair” especially when COVID hit hard on the learning environment in the 2020-21 school year. MAP does not provide a real picture of the current learning that the students are experiencing in Lindbergh Schools.
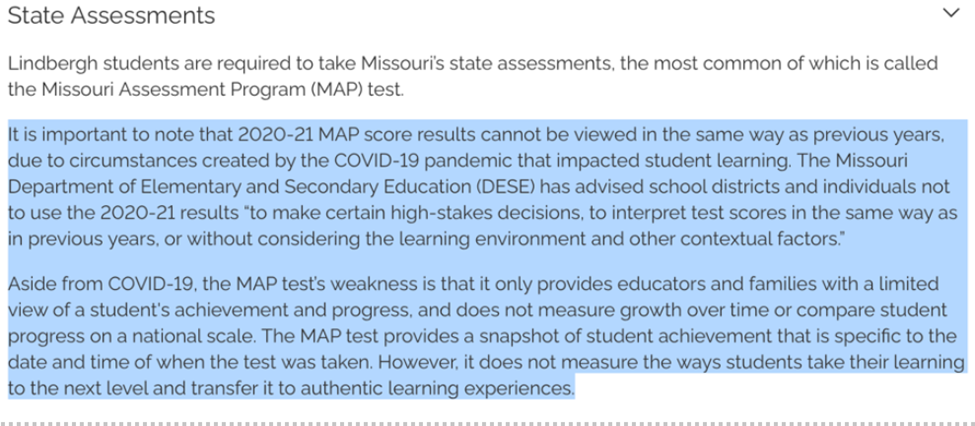
Source: Lindbergh Schools website: https://go.lindberghschools.ws/Page/16217
So far, this is how the district communicated the issues it was dealing with. To remedy the deficiency of the MAP testing as a useful tool for the district, Lindbergh Schools started multiple assessments programs in the last few years. These assessments begin in the lower grades where the MAP test is not offered and provide an alternative assessment with tools such as FastBridge for ELA and iReady for Mathematics. NWEA is used for the grades that the MAP program is given by the state and is benchmarking the district now for at least three time a year.
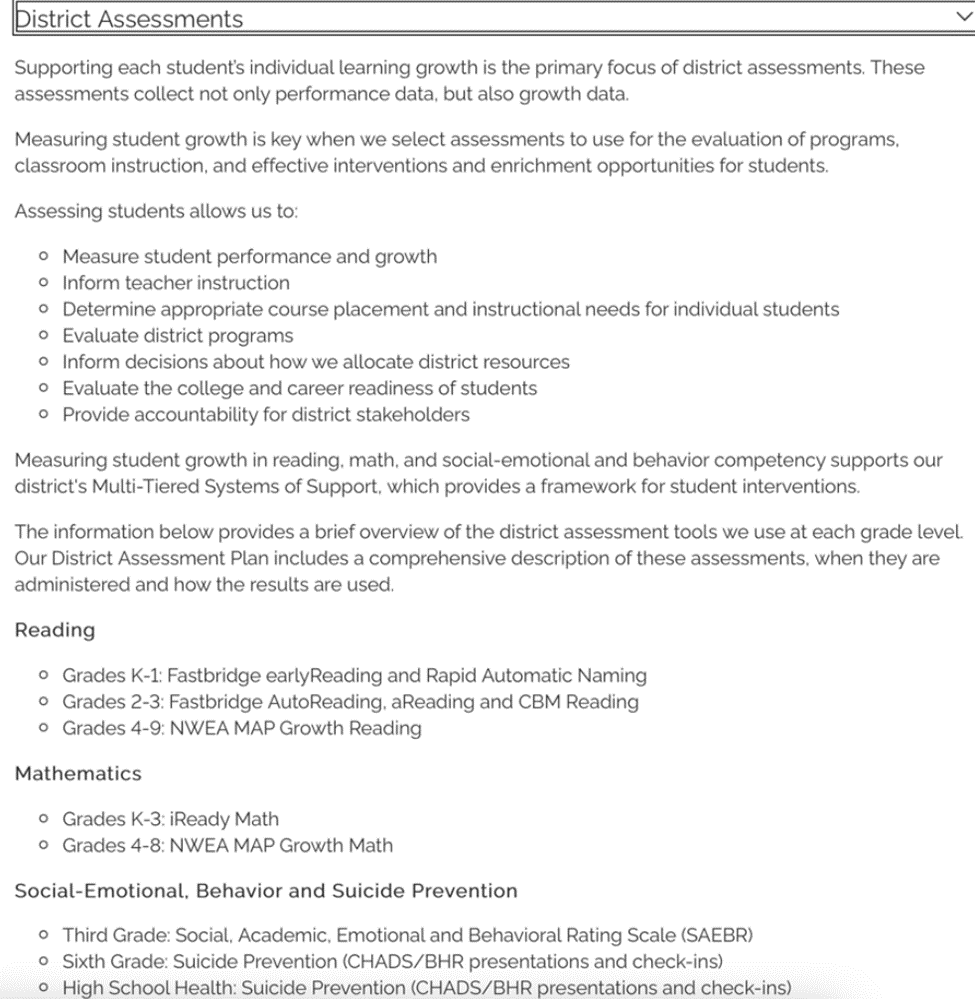
Lindbergh Schools has detailed descriptions of these different assessments and guiding documents to interpreting assessments results. https://go.lindberghschools.ws/Page/16219. Here is the good news, we believe NWEA is a predictive tool to MAP results and we can rely on it.
So how does NWEA compare to MAP in practice?
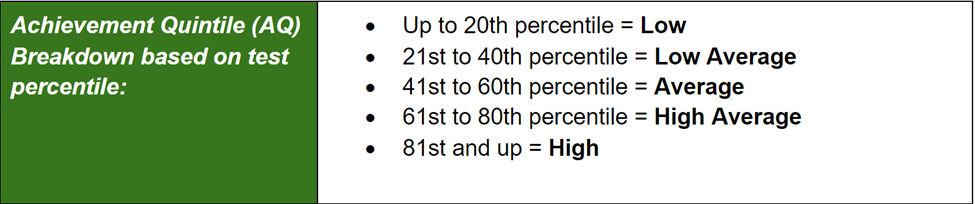
To understand the real academics performance of Lindbergh Schools and how learning growth is happening, it is suggested to investigate the NWEA data, since NWEA is measuring not only the performance but also the growth. According to the district’s guiding document, there are five tiers of results in NWEA:
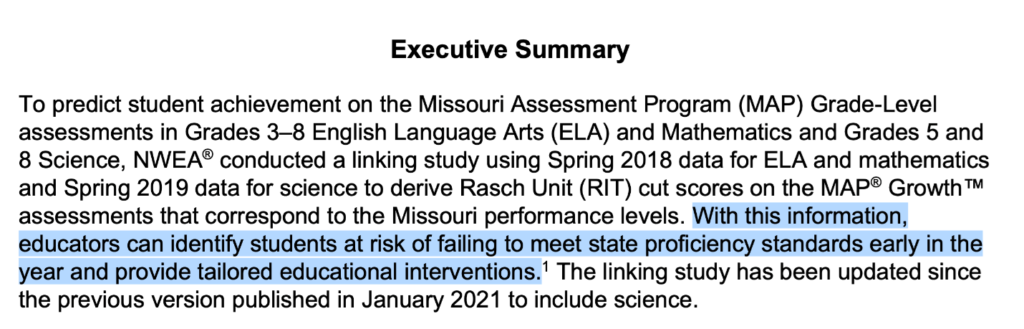
NWEA has their own periodic study every five years and provides guidance documents to read the assessments. According to these studies, the 50th percentile student is not projected to score proficient in MAP:
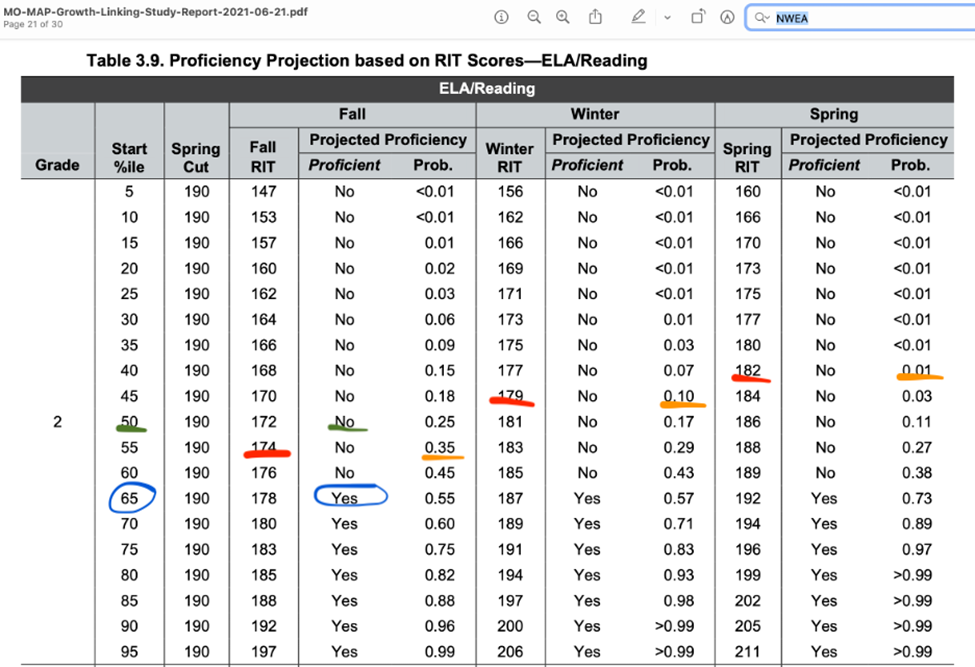
Taken from MO-MAP-Growth-Linking-Study-Report-2021-06-21
This table shows the percentile where assessment score could fall on (Fall RIT, Winer RIT, and Spring RIT), and if that score projects proficiency probability. If a student scored 174 in the Fall and then 179 in Winter, there is progress (the score went up), yet the student went down in percentile (55th percentile to 45th percentile) and the probability to score proficiency also went down from 35% to 10%. If the same student scored 182 in Spring, the probability went down to 1% chance at proficiency.
One should pay attention to the phrase “Projected Proficiency” while reading this table – NWEA assessments are designed to project the proficiency as outlined on MAP. In other words, NWEA assessments are designed to assess the MAP test and measurement of proficient performance for students. In addition, the probability of a score to meet proficiency is given only at the 65th percentile and up. (There are grades where this probability is projected at the 60th percentile or 55th percentile, but not lower). In other words, to score proficient in MAP program, students should be scoring a high average of 61st to 80th percentile or high of 81st and up percentile in NWEA tier assessments.
NWEA and Lindbergh Schools:
Unlike MAP data, which is collected and published by the Department of Elementary and Secondary Education, NWEA is a district assessment which data is not available to the public unless sunshine requests are submitted, although in recent days the district has elected to release individual student NWEA data to the parents. These reports, however, do not provide the district level performance assessment. The following graphs are provided by the David Randelman Committee who requested the data and analyzed.
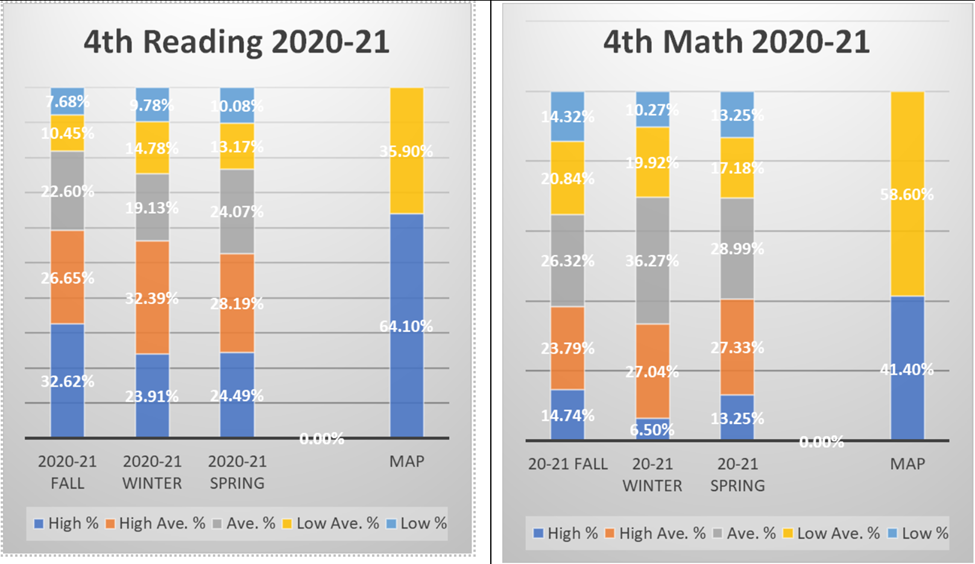
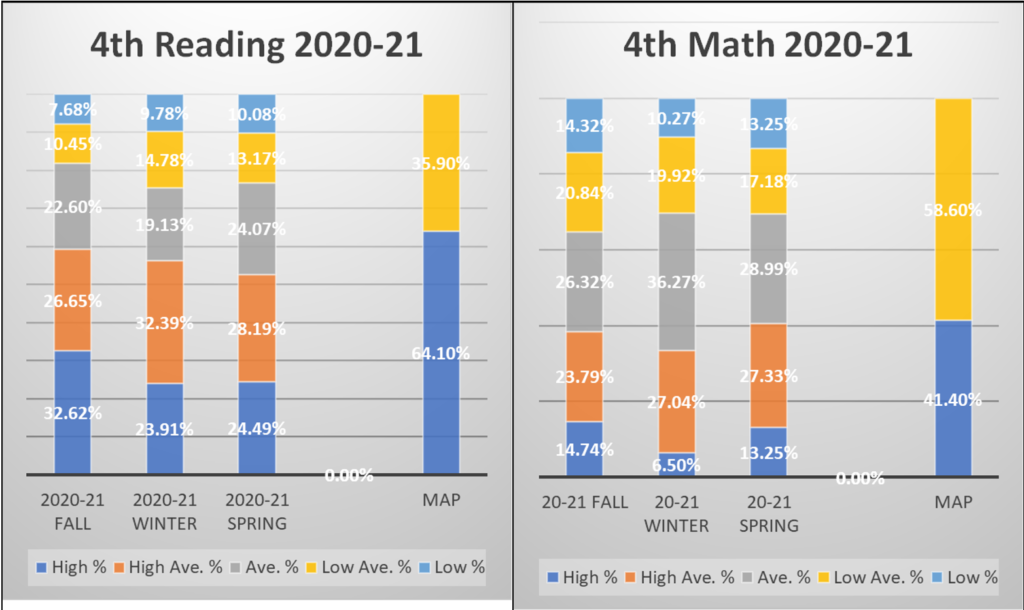
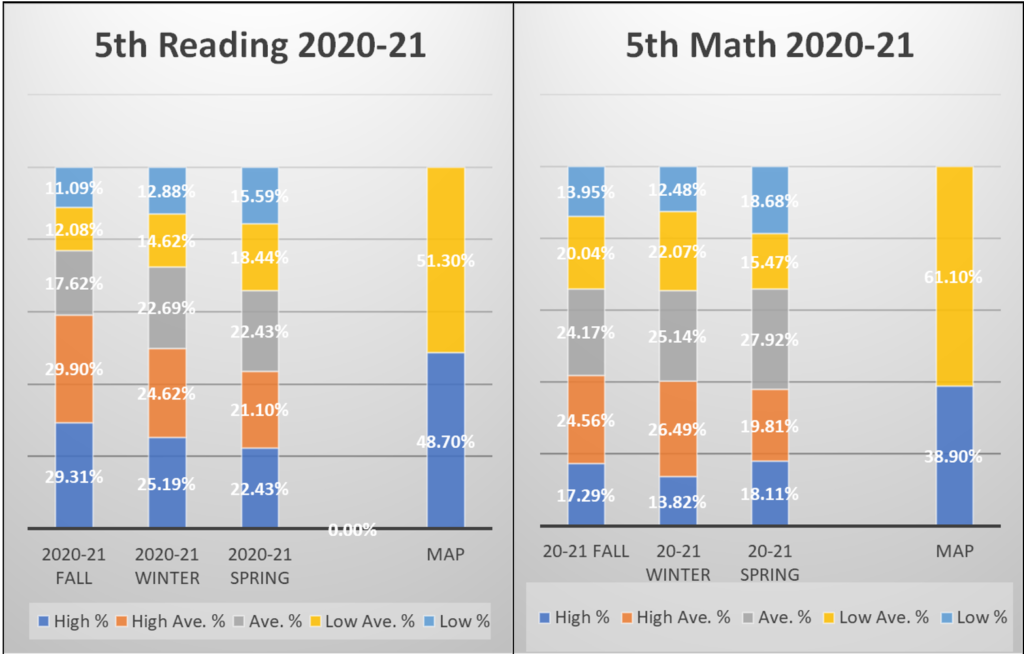
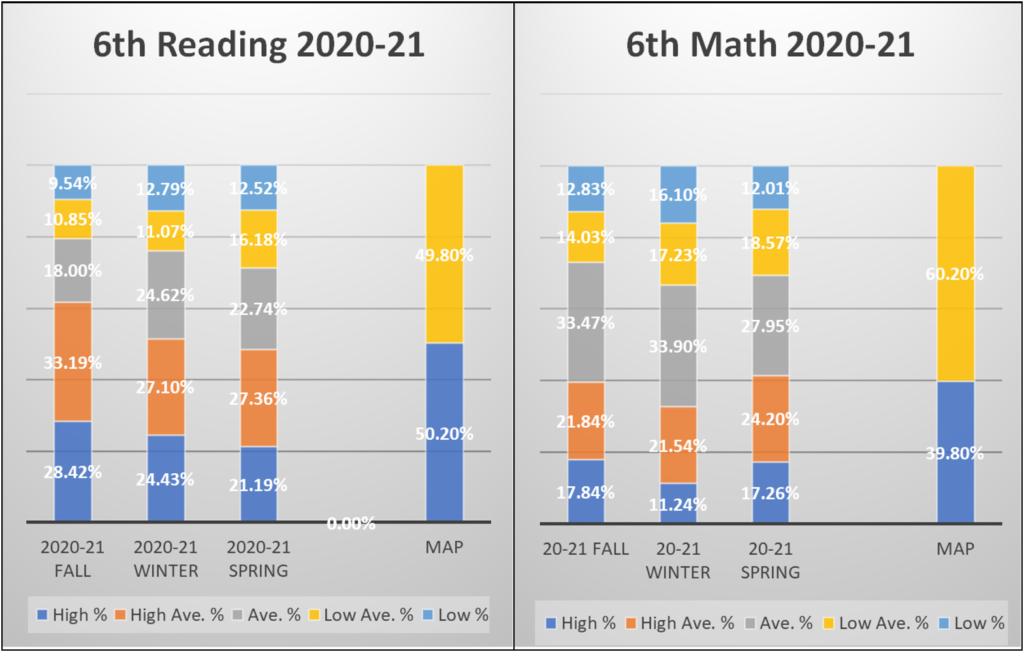
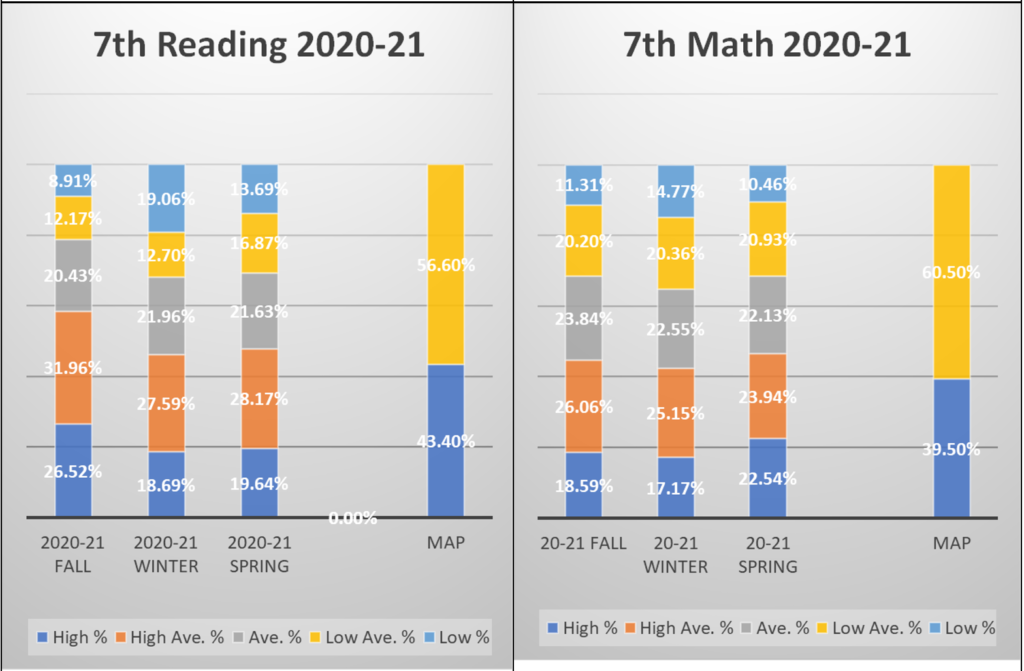
2020-2021 NWEA vs. MAP
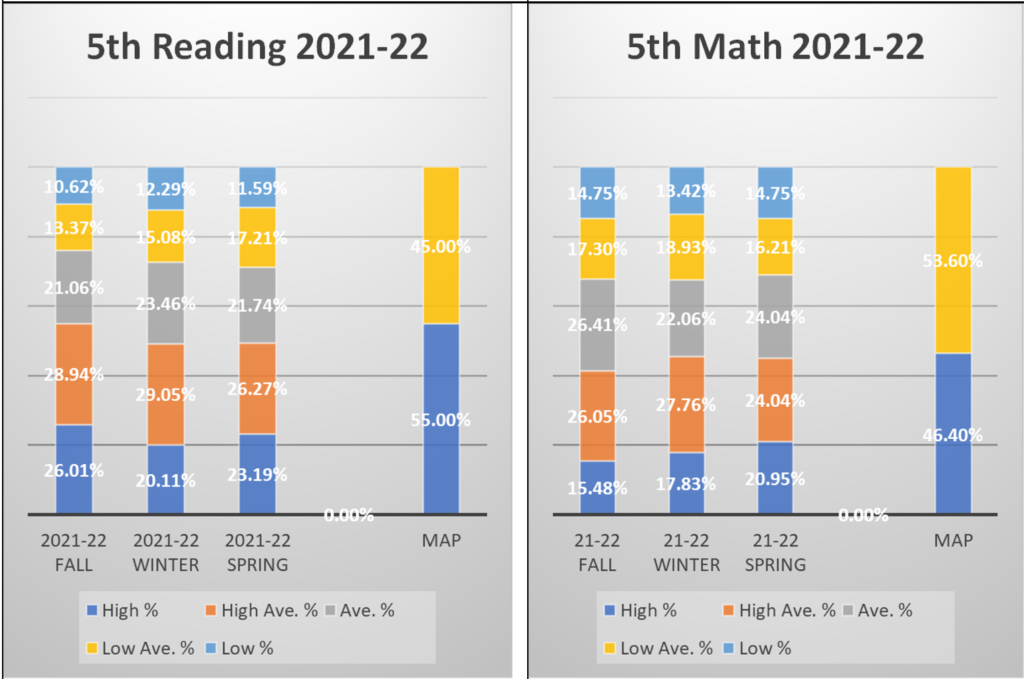
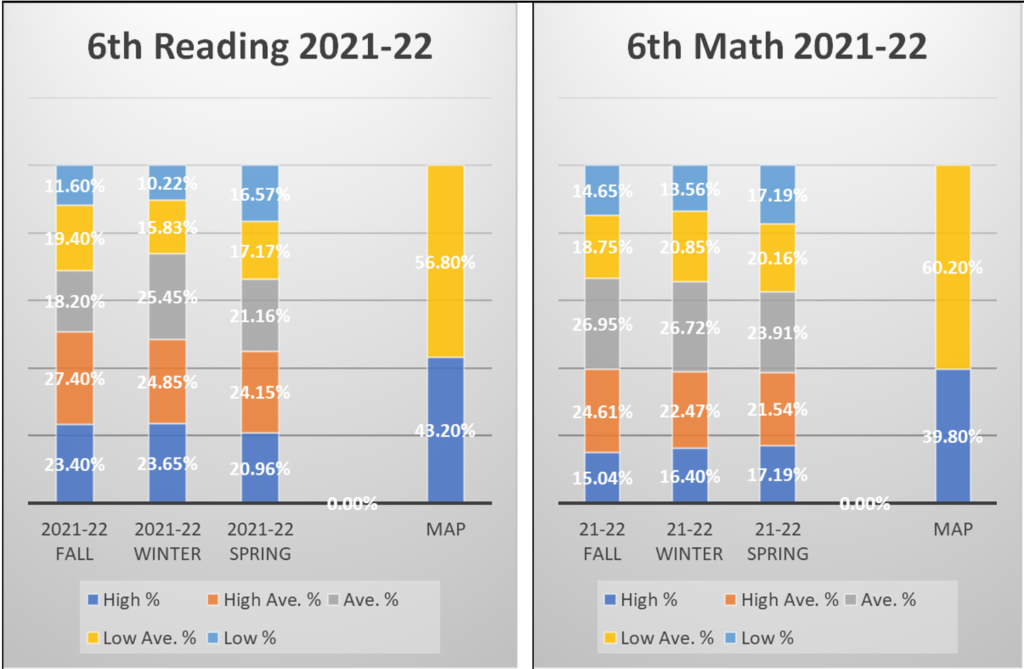
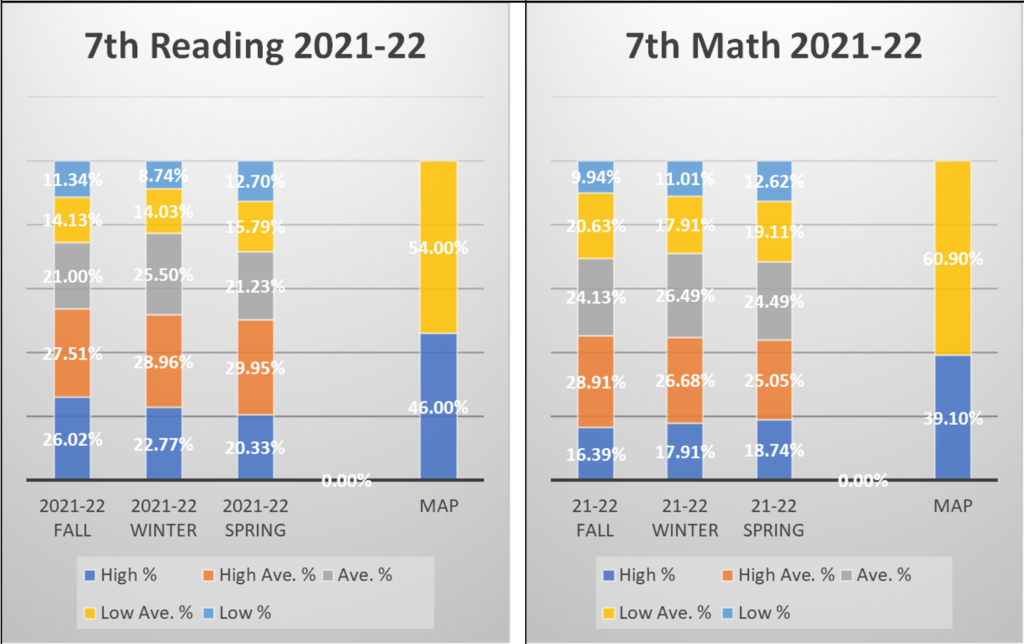
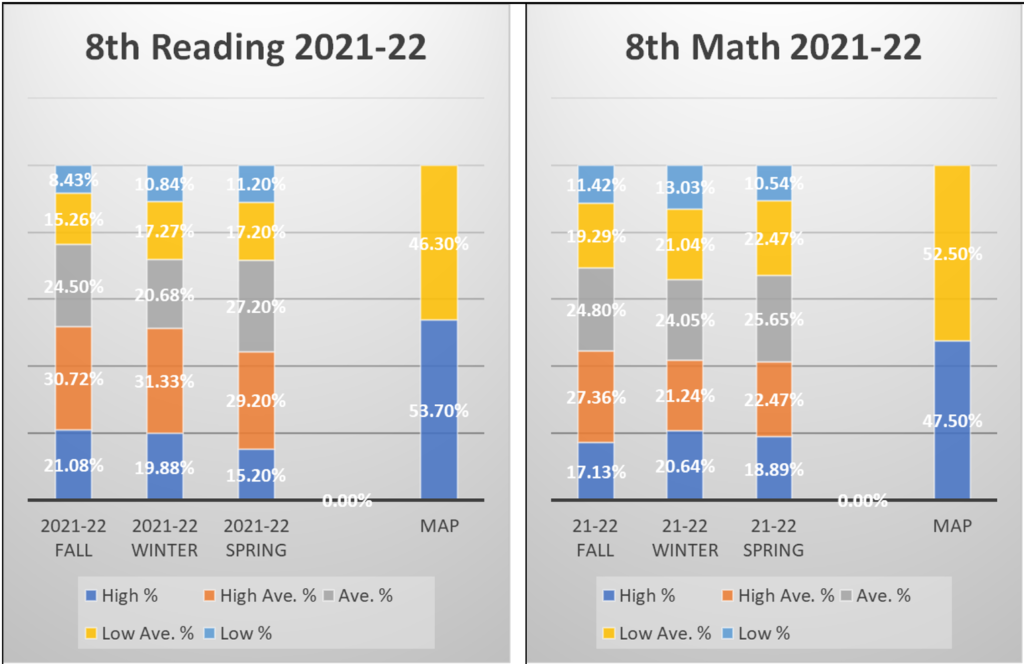
So with the above understanding on how Lindbergh Schools implements NWEA, we can now look at NWEA results and compare them to the MAP scores over the years. When looking at the following graphs, it is notable that in most grades, more students scored “Proficient” and above in MAP than NWEA Spring assessment projection. MAP is somewhat more optimistic than NWEA on the percentile tier projection. Each graph table contains three column graphs, on the left there are NWEA assessments (Fall, Winter, and Spring). The right column graph is of the MAP results, and they are shown in two tiers – lower blue color is “Proficient and above” and upper yellow color is “Below Proficient”.
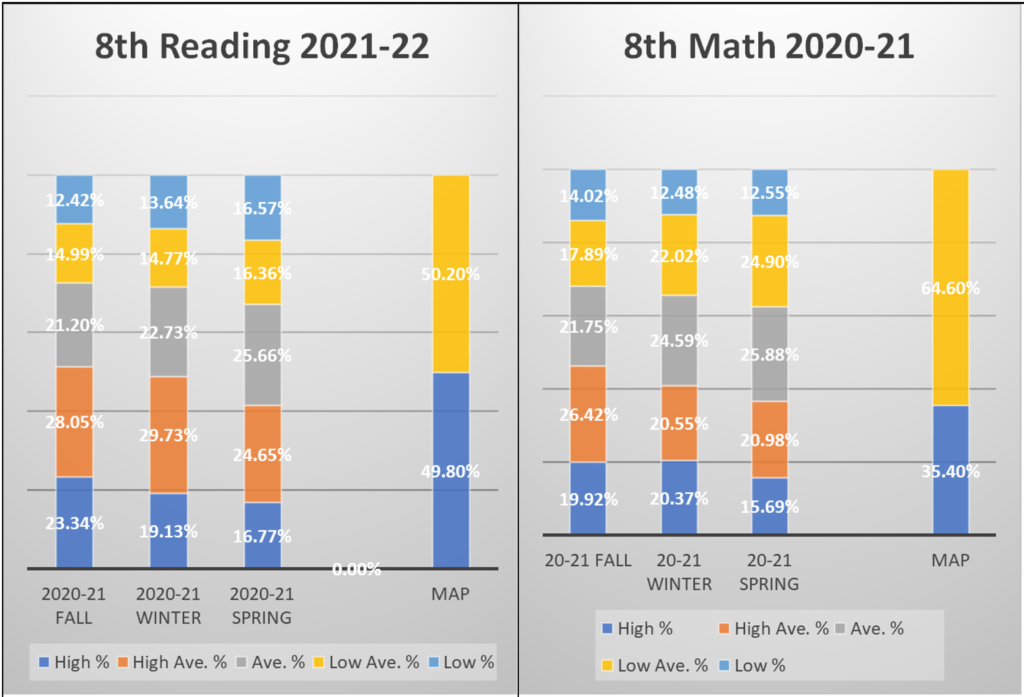
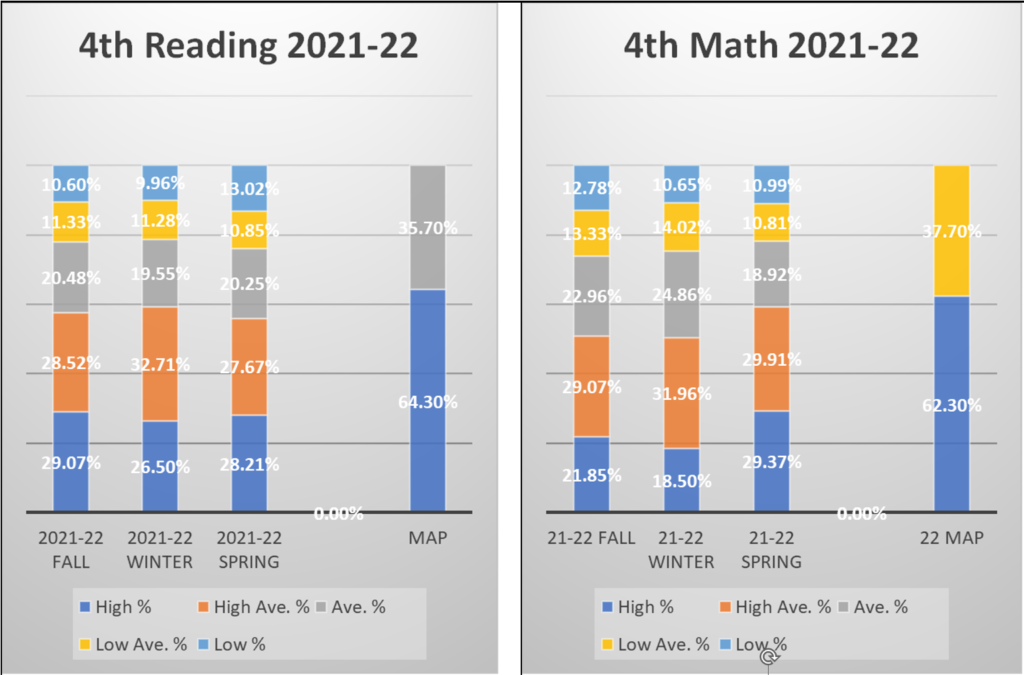
2021-2022 NWEA vs. MAP
Like 2020-2021 and 2021-2022, NWEA projection was quite accurate on MAP outcome. And sadly, the percentage of students who remain in the lower tiers is not reduced as the school year progresses. Is there a growth? Probably. Is there a growth out from low and low average into average and high average tiers within our school district? The reader should look at the data and interpret it.
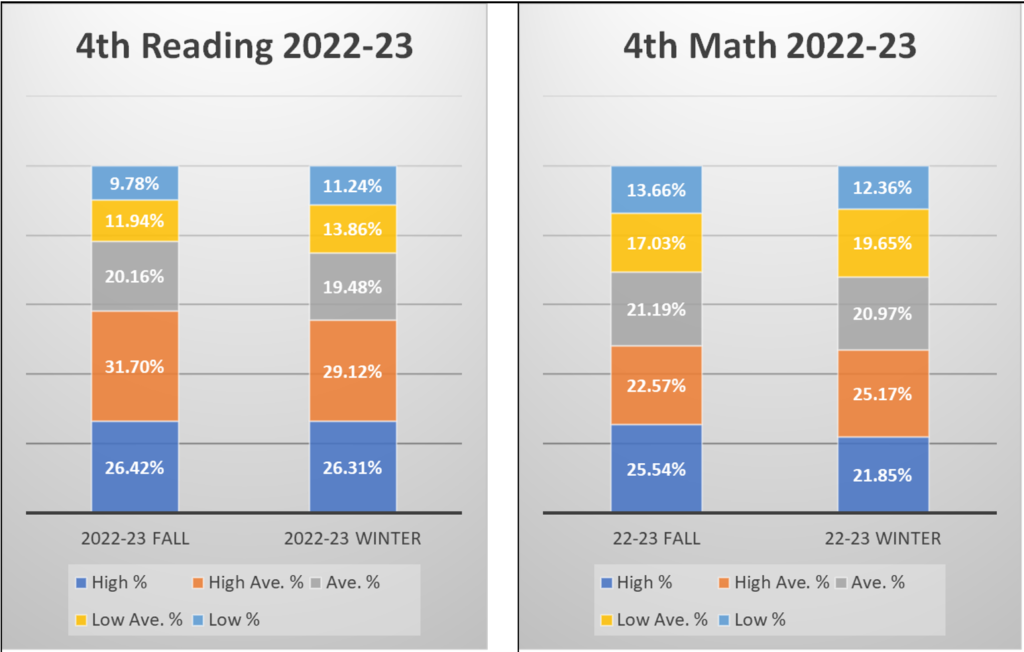
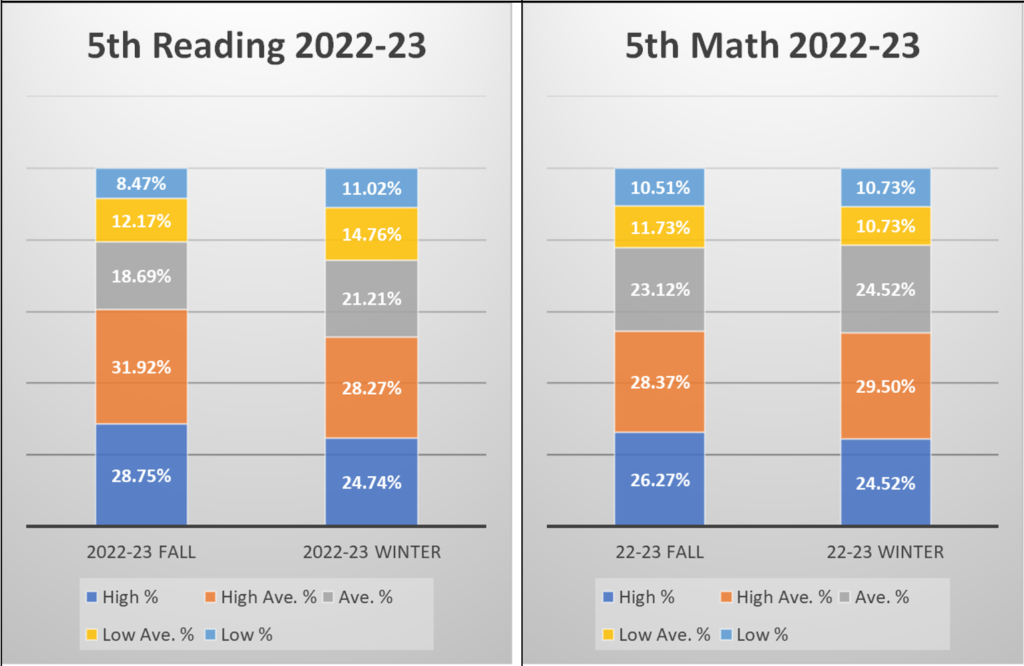
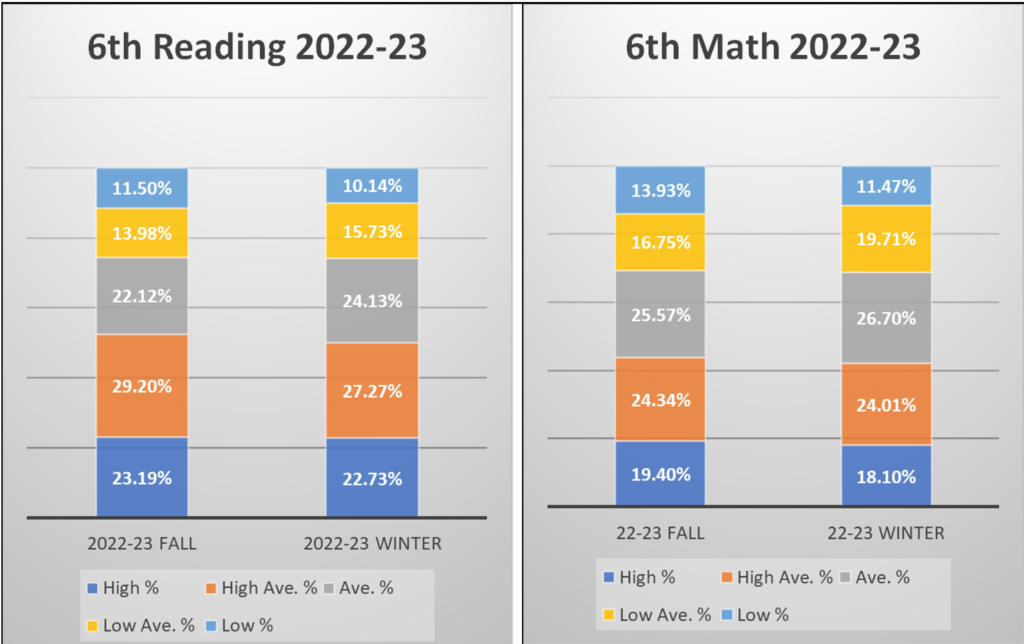
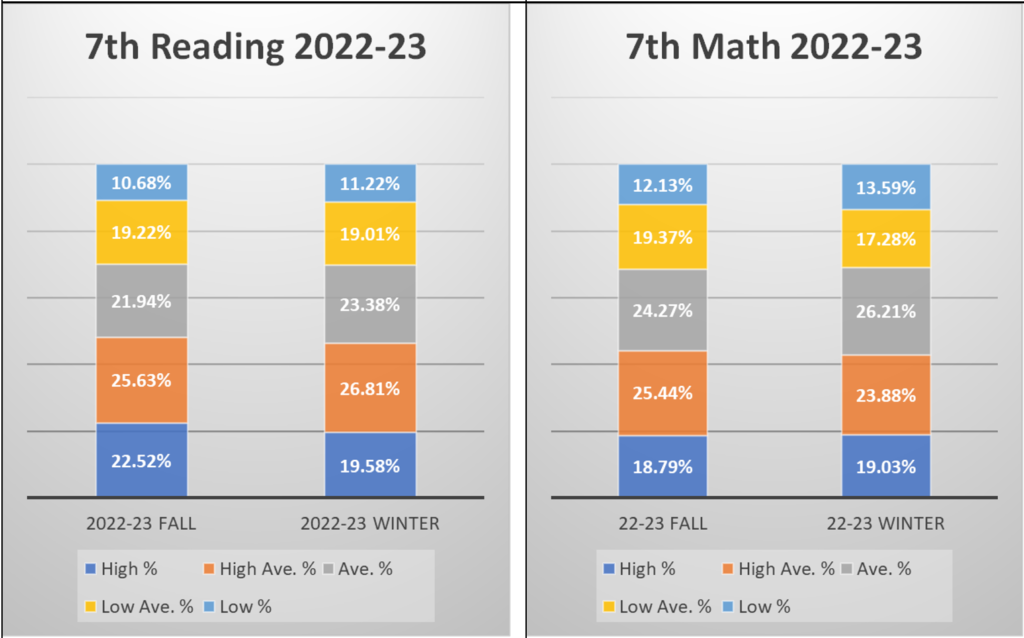
2022-2023 NWEA
Although we cannot compare the current school year NWEA to MAP since we are prior to that state assessment, we can still get a predictive picture of where our students are trending towards based on the prior years with a high degree of certainty. Again, the questions that should be asked are: “Is Lindbergh Schools students’ growing in proficiency?” and “Does this performance indicate any decline of the academic standard of Lindbergh Schools?” or “Are we content half or less of our students scoring ‘proficiency’”?
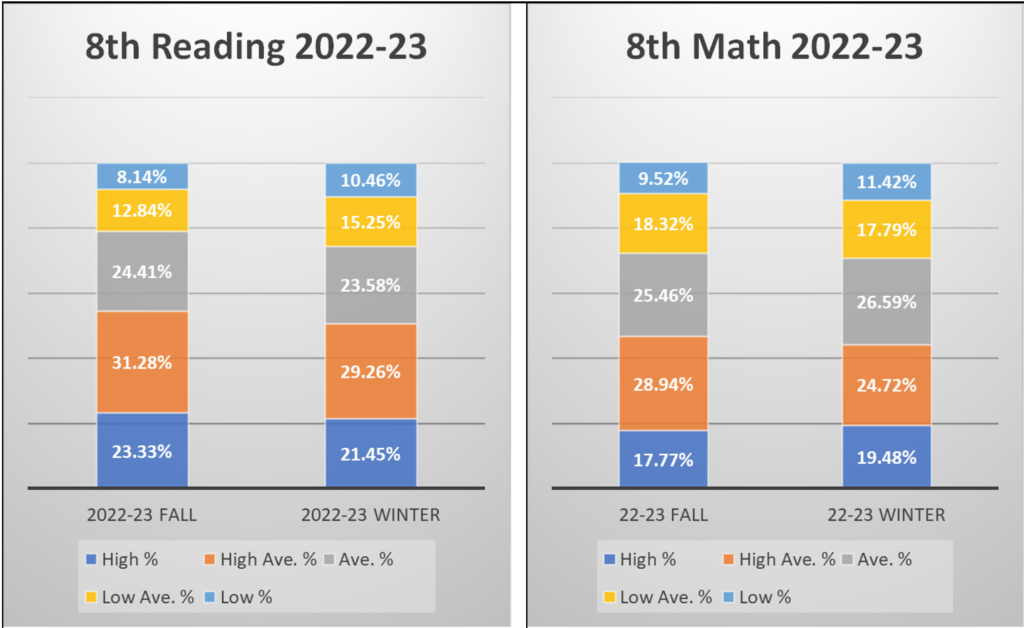
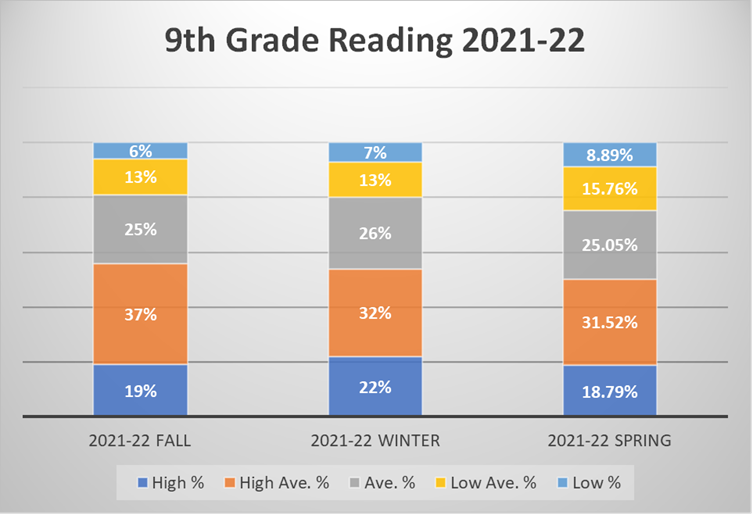
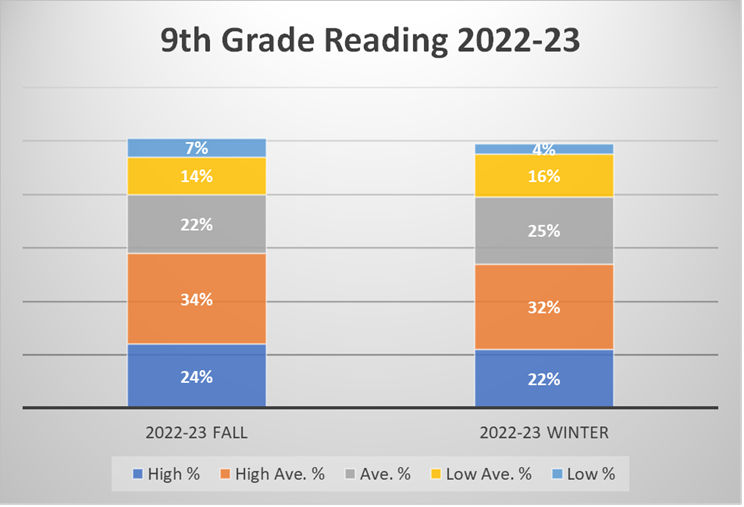
The Positive side of NWEA
Unlike MAP, NWEA assessments in reading (not mathematics) are given to the high school freshmen students as well. Although there is no MAP data to compare to, it is noticeable that the lower tiers are thinner once the students are in high school. This shows that the teaching and learning environment in the high school brings growth to the students as less students are left in low performance tiers. (Although “proficient and above” students are still about 50-55%)
Conclusion:
In conclusion, both benchmarks have their purpose, the MAP test is the only exam that allows for school district comparison to other districts in our state and an understanding of our relative performance, in other words, accountability. NWEA is a must have predictive progress benchmark to understand our proficiency in terms of Missouri state standards on a student-by-student level as a tool for the district, so that they can better prepare custom teaching and create a positive progress towards proficiency. Both metrics not only compliment each other but have proven that NWEA is a predictive and reliable tool for actual MAP results in practice. In fact, NWEA growth shows we are even slightly worse off than the MAP results show in practice. We still have a lot of improvement to do as a district to climb back to higher proficiency rates but we are happy to embrace tools that help the district understand their placement during the trimester so that adjustments and improvement can be made.
Chapter 3:
What is happening with our NWEA benchmark scores? Hint- we are on our way to having over 50% remain below proficiency*
Preface:
The district has stated on multiple occasions that the state MAP data is not the best source of information to measure our student’s growth. The district has repeatedly indicated the NWEA scores are a better measure. Unfortunately, the NWEA scores have not been disclosed by the district. Pursuant to a Sunshine request, we received the most recent data. We have compiled the data below. In addition, we want to emphasize that this information is not reflective of our teachers but rather the likely changes in literacy and math programs.
How we analyzed the data:
Once the LS District provided the data, we placed that data in tables in order to understand where we are in our proficiency rates. We can see from the indicated results that it is important to have a good understanding of the causes for such a high number of students below proficient.
NWEA Information:
RAW DATA from Sunshine request:
In order to independently analyze, please download the original LS district data and then use the bellow NWEA link page 21-24 to understand the numeric cut off values for each grade and period.
Source: NWEA
NWEA takes the total grade average score and gives a probability of the average student likelihood to passing with state standard proficiency. When the probability is low (e.g. less than 50%), it means that more than 50% of the students are currently not likely meeting the state standard with “proficient” or in other words, failing.
| Performance Results: Language Arts- Reading 2021-22 | ||||
| Grade | NWEA Fall LS | NWEA Winter LS | NWEA Spring LS* | NWEA: Average Probability for MAP Proficient |
| 4th | 203 | 208 | – | 65%-78% probability to meet proficient (CUT=205) |
| 5th | 209 | 212 | – | 35%-50% probability to meet proficient (CUT=213) |
| 6th | 214 | 217 | – | 42%-58% probability to meet proficient (CUT=218) |
| 7th | 219 | 222 | – | 42%-58% probability to meet proficient (CUT=223) |
| 8th | 222 | 224 | – | 50%-65% probability to meet proficient (CUT=223) |
| Performance Results: Mathematics 2021-22 | ||||
| Grade | NWEA Fall LS | NWEA Winter LS | NWEA Spring LS* | NWEA: Average Probability for MAP Proficient |
| 4th | 202 | 209 | – | 50%-67% probability to meet proficient (CUT=208) |
| 5th | 210 | 216 | – | 20%-34% probability to meet proficient (CUT =219) |
| 6th | 216 | 220 | – | 26% probability to meet proficient (CUT=224) |
| 7th | 223 | 227 | – | 33%-58% probability to meet proficient (CUT=229) |
| 8th | 227 | 230 | – | 5%-15% probability to meet proficient (CUT=236) |
NWEA 2021-2022 current indicators.
When looking at the current year, up to the winter test disclosed we can see that the patterns are the same or worse than last year. This is concerning because the current year did not exhibit a pandemic interruption like the last and had in-person learning from the start of the year. The data indicates that we are no closer at closing our gaps to a Missouri state standard proficiency with the current trajectory.
* Based on current NWEA progress projection
Chapter 2
What is happening in Lindbergh Schools Education – Part two, the “Living Curriculum”
In 2018/2019 when the new curriculum was approved by the Board, the Board was also presented with a disclaimer in place advising that the program can and will change over time, this is the definition of a “Living Curriculum”.
Source: BOARD DOCS
This promoted a change or shift in how curriculum is implemented. The following presentation slides were presented to the board advisory committee that indicate the shift away from “instruction” and move to “curriculum”.
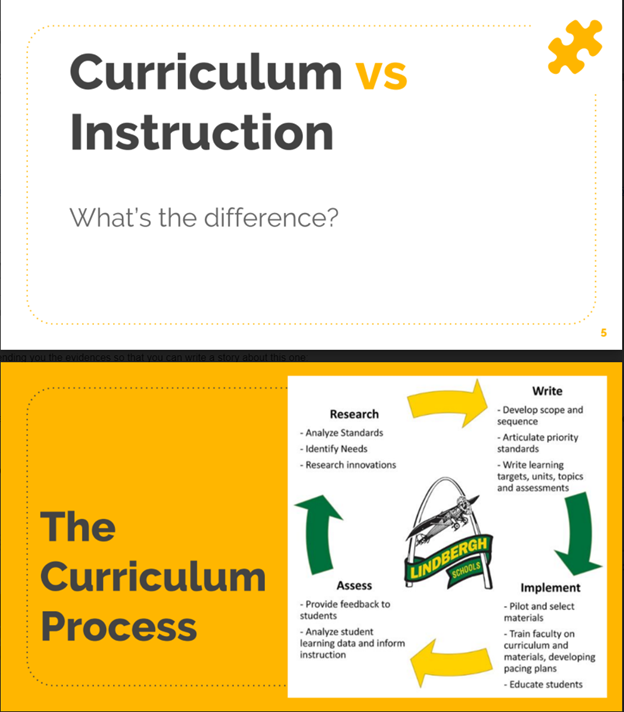
…but not just a curriculum but a “living” one.

*source BOARD DOCS
Now let’s examine what happened as a result. If we look at English 2 Honors, we see the following original board approve curriculum book list:
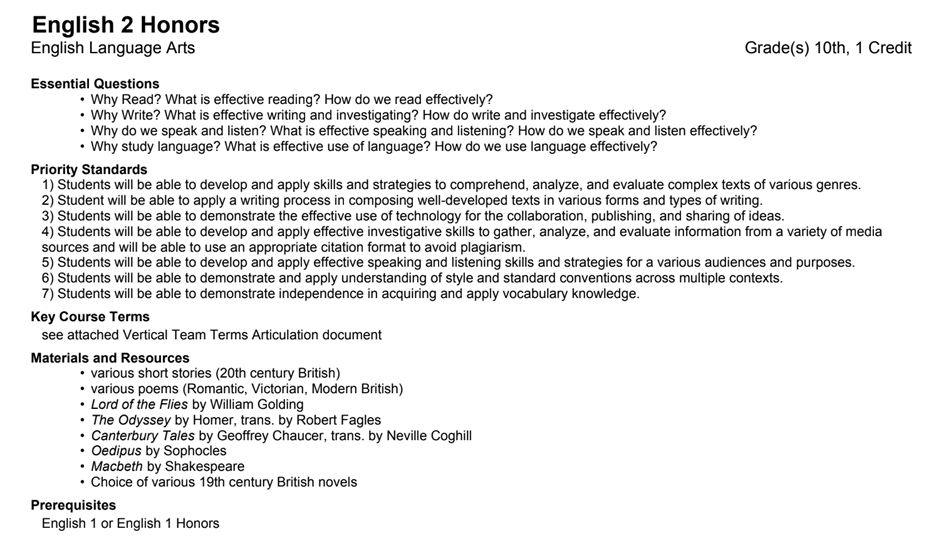
The books are mostly classic literature with literacy and educational value. Such as:
- Lord of the flies
- The Odyssey
- Canterbury Tales
- Oedipus
- Macbeth
- Etc.
The “Living” curriculum allowed for a replacement to the following books in its place, it is important to note that the content warnings are at the source, by the teacher:
- “Ceremony” (mental illness),
- “The House in the Cerulean Sea” (emotional abuse of children)
- “Monday’s not Coming” (physical and sexual abuse)
- “Their Eyes Were Watching God” (domestic violence and sexual assault)
- “The Water Dancer” (sexual, physical and emotional abuse)
- ”The girl who fell from the sky” (Domestic child abuse and suicide)
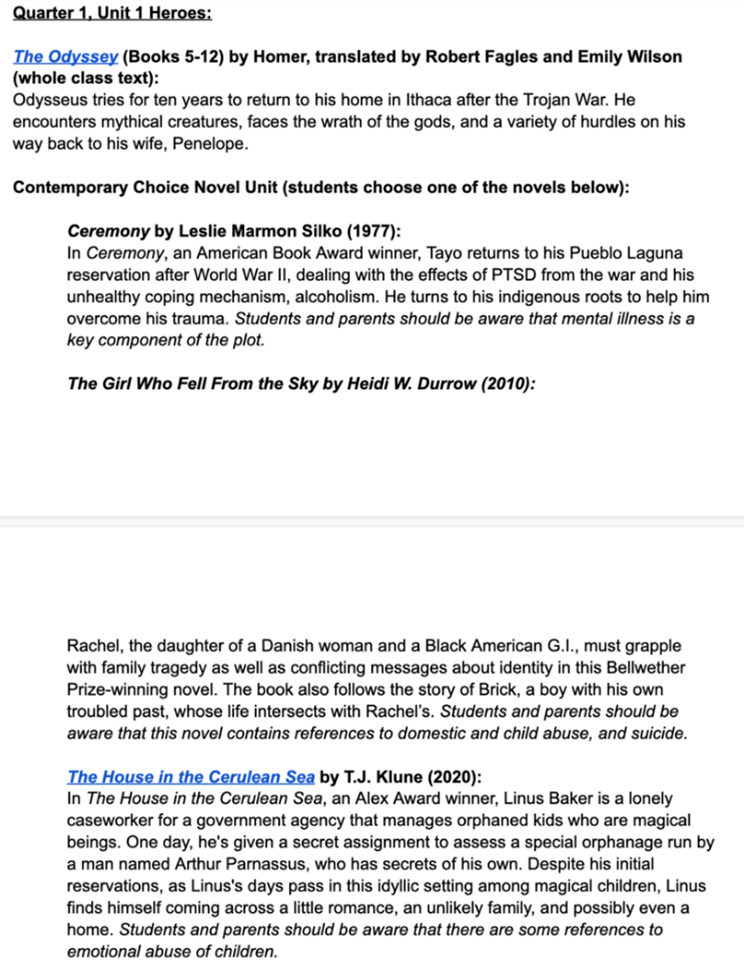
This is the result, removal of board approved curriculum and dynamically granting it to different sources.
Other effects:
- The introduction of unapproved curriculum
- Use of narrative or un-objective lenses, including CRT (Critical Race Theory)
- Disparities between different teachers and inconsistencies as to what educational material the students are learning.
- Proliferation of ideological and/or political doctrines as a method of delivering the curriculum instead of an objective vantage point that allows for the students to apply their freedom of conscience and promote a healthy debate.
Chapter 1
MAP MATH- Class of 2024 tracking from the 3rd grade to the 7th grade
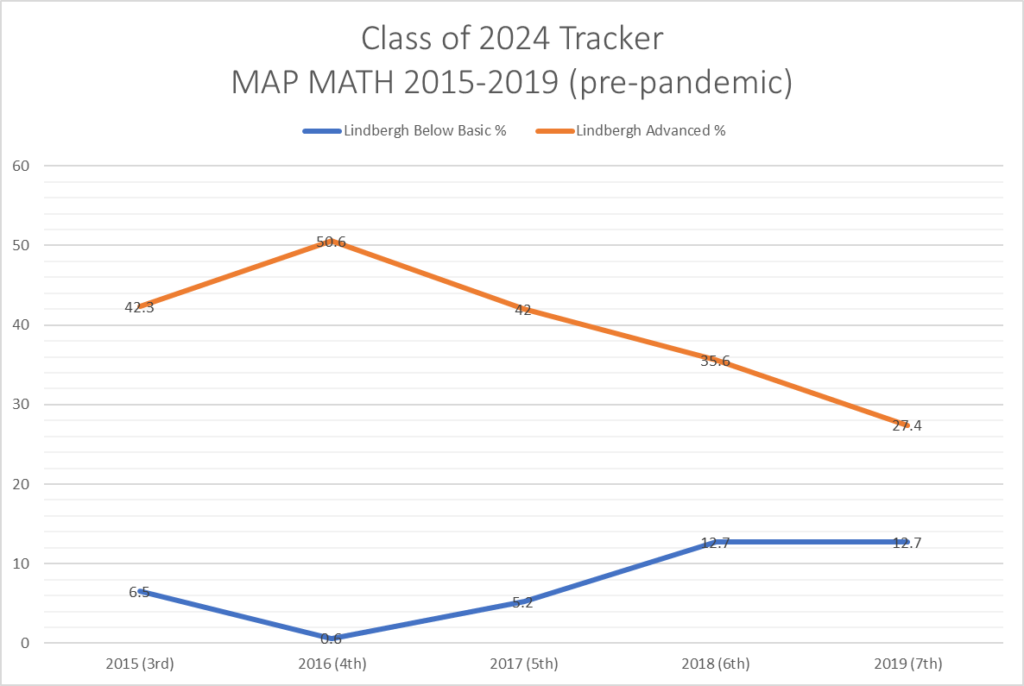
This graph tracks the class of 2024 through the years. The orange line shows the percentage of students in advance math in 2015, from 2016-2019 there is over a 23% of total students that dropped out. In parallel, we see an increase from 0.6% failing with below basic to over 12.7% in 2019. All this is pre-pandemic.
MAP MATH- every 3rd grade from 2015-2021
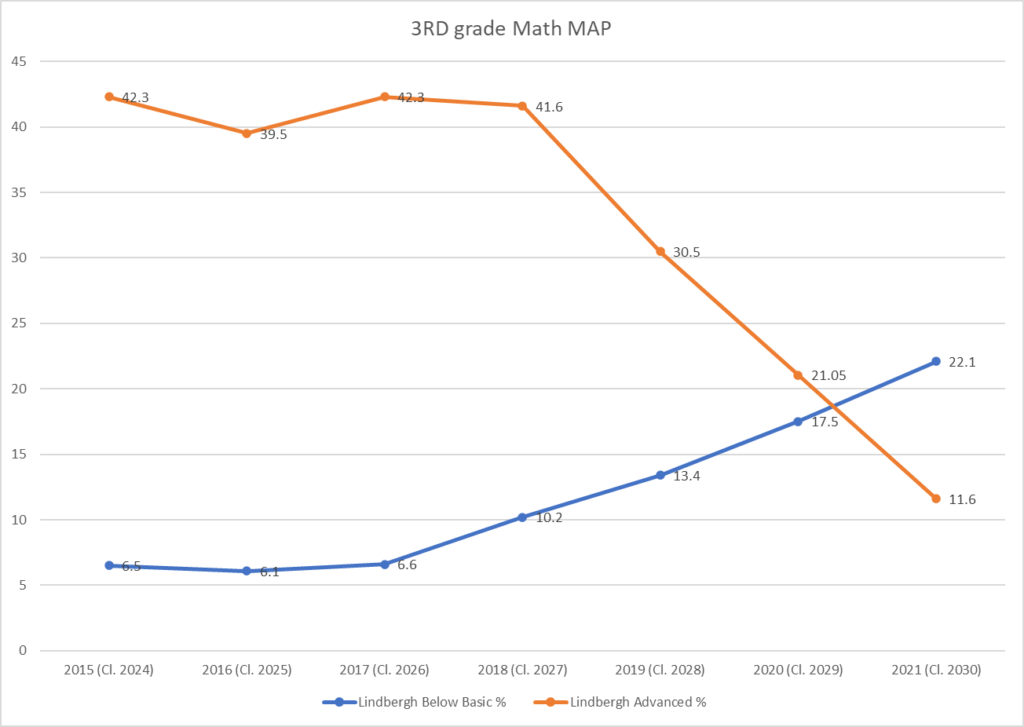
This graph shows a different angle of the data, we look only at the 3rd grade from 2015-2021, each class of the 3rd grade is measured. In 2015 we had 42.3% of students in advance math and only 6.5% below basic. In 2019 (pre-pandemic) we were down to 30% in advanced and failing went up to 13.4% of all students. In 2020 there were no MAP tests because of the pandemic, the number there is an average of 2019 and 2021 and is a projection, it is interesting to note that the graph remains linear. Finally in 2021 we see the graph got inversed with now 22.1% of all students below basic (failing) and only 11.6% of students remaining in advanced math.
It is hard to pin point a single cause for this tragic decline in our beloved school district but we can point to a number of likely contributors:
- Removal of math intervention in 2019
- Change of curriculum
- Living curriculum approach introduced in 2018
- A switch to Missouri State standard based learning
In the coming weeks we will continue to analyze and demonstrate other statistics, stay tuned!
- All data sources are taken from DESE